
AI Insights
A generated reading of the last thirty days of revenue and of customer retention, with the at-risk customers to call.
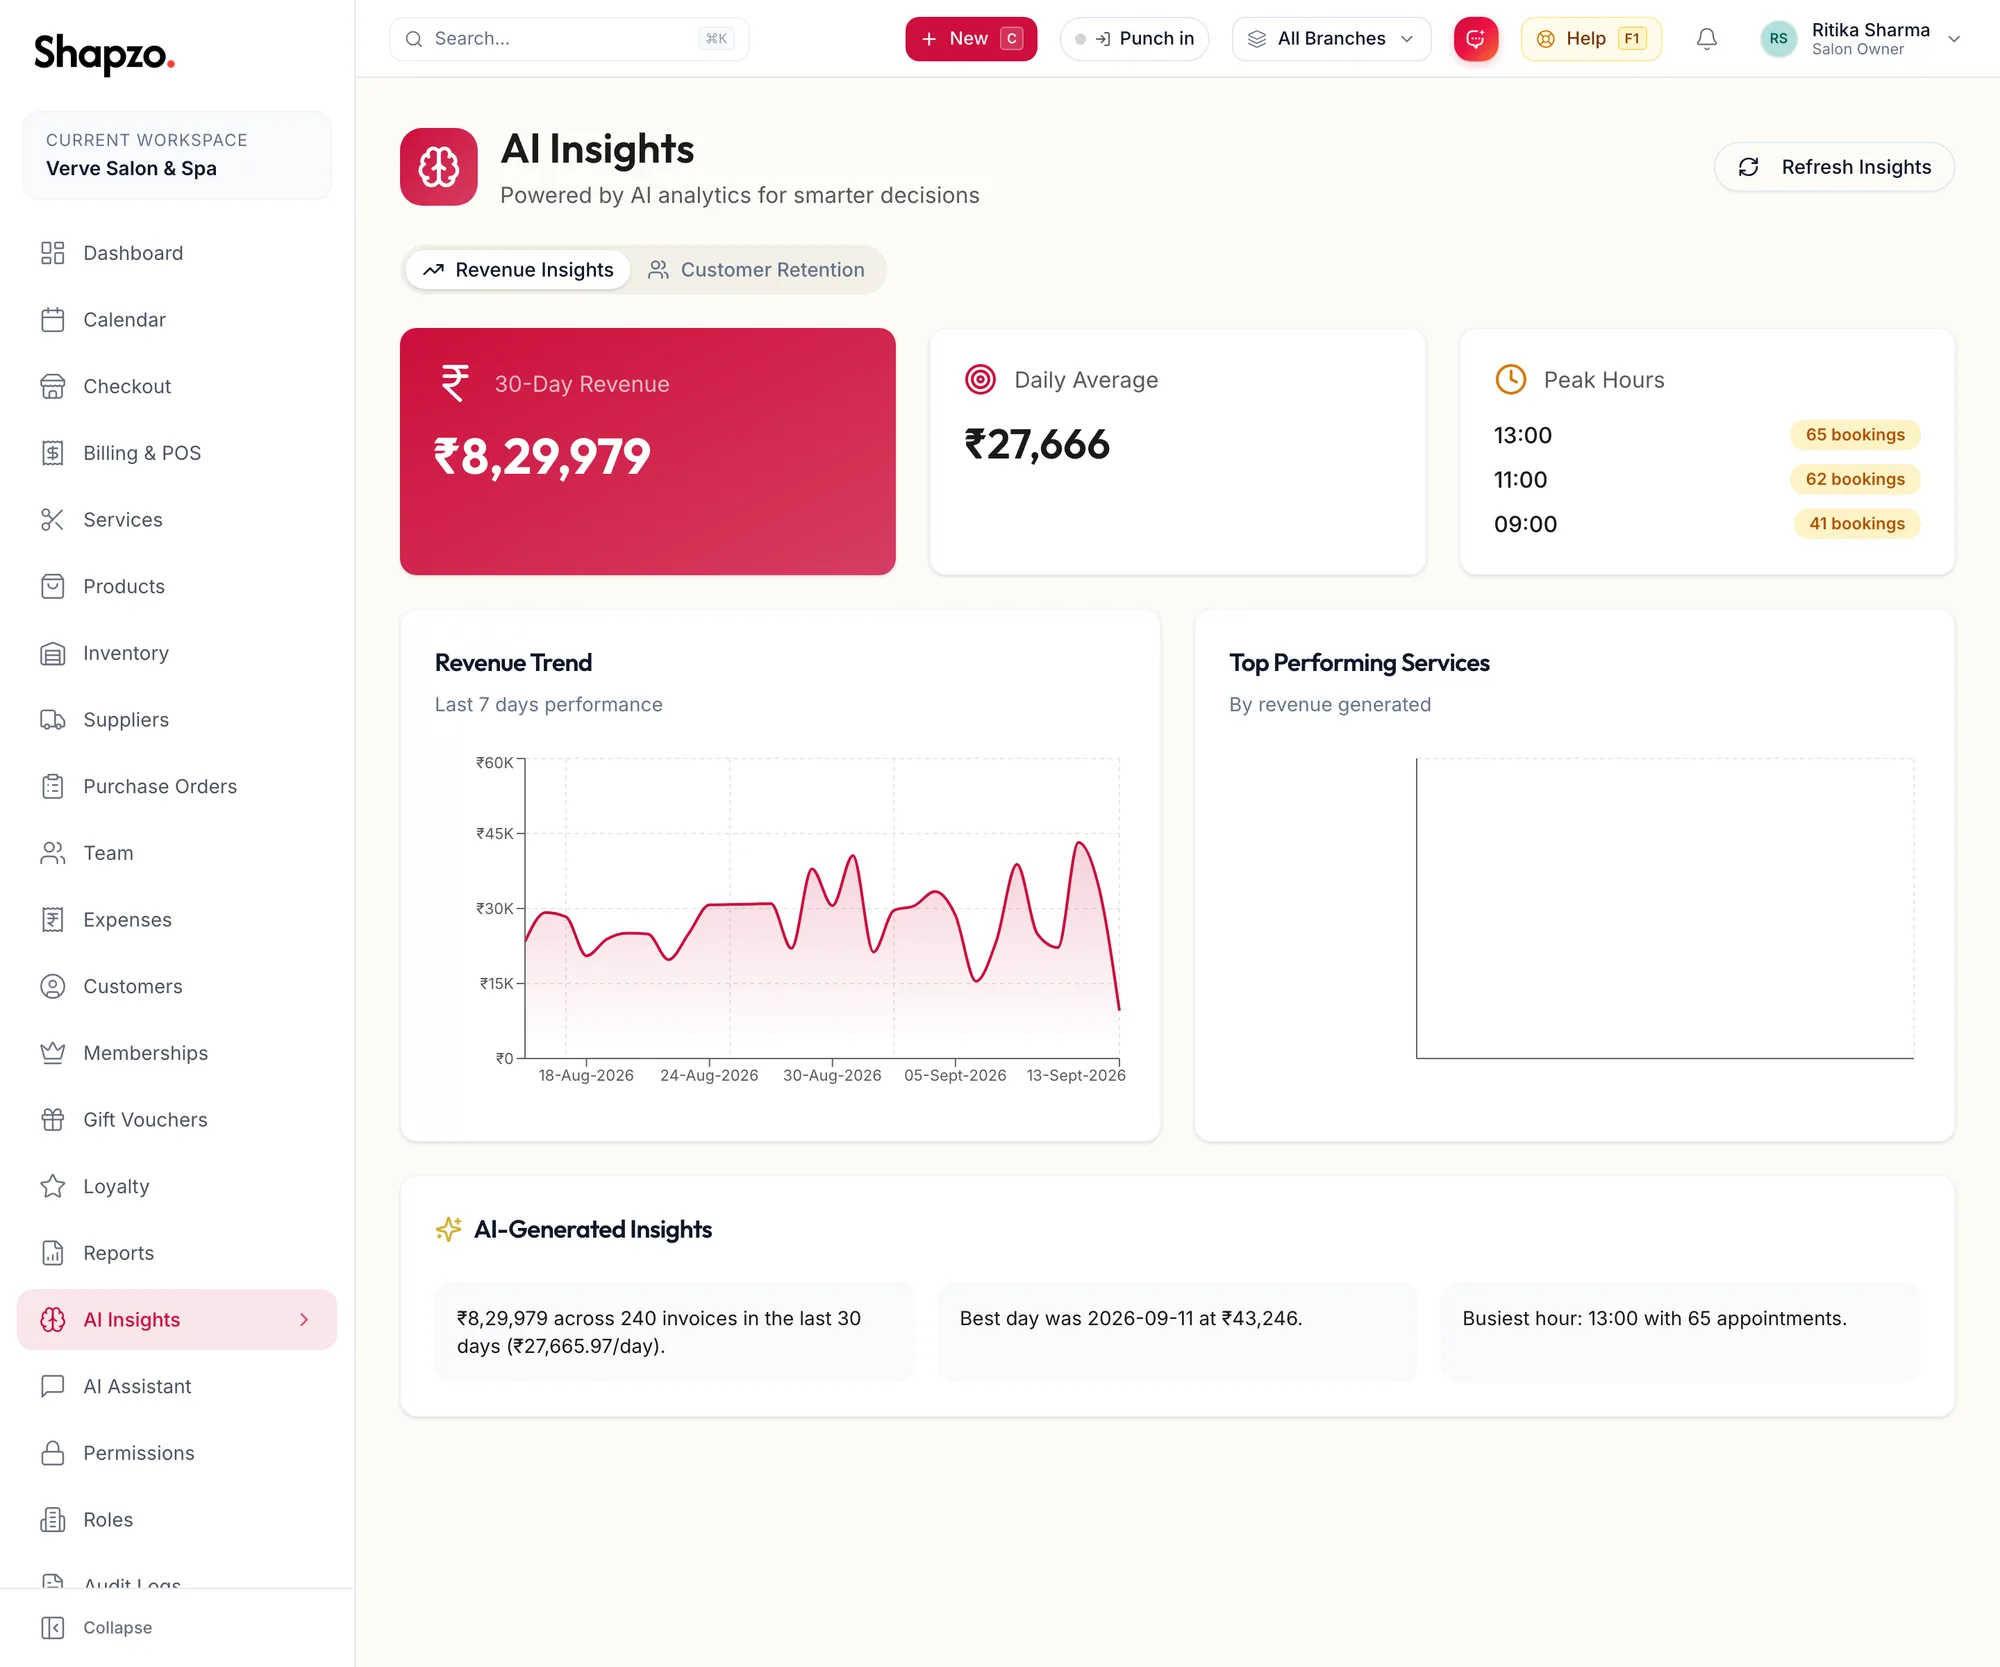
Open AI Insights. Two tabs.
Revenue Insights
On the web
30-Day Revenue, Daily Average and Peak Hours, a Revenue Trend for the last seven days, Top Performing Services by revenue, and AI-Generated Insights: a few sentences on what moved and why, written from your numbers.
In the app
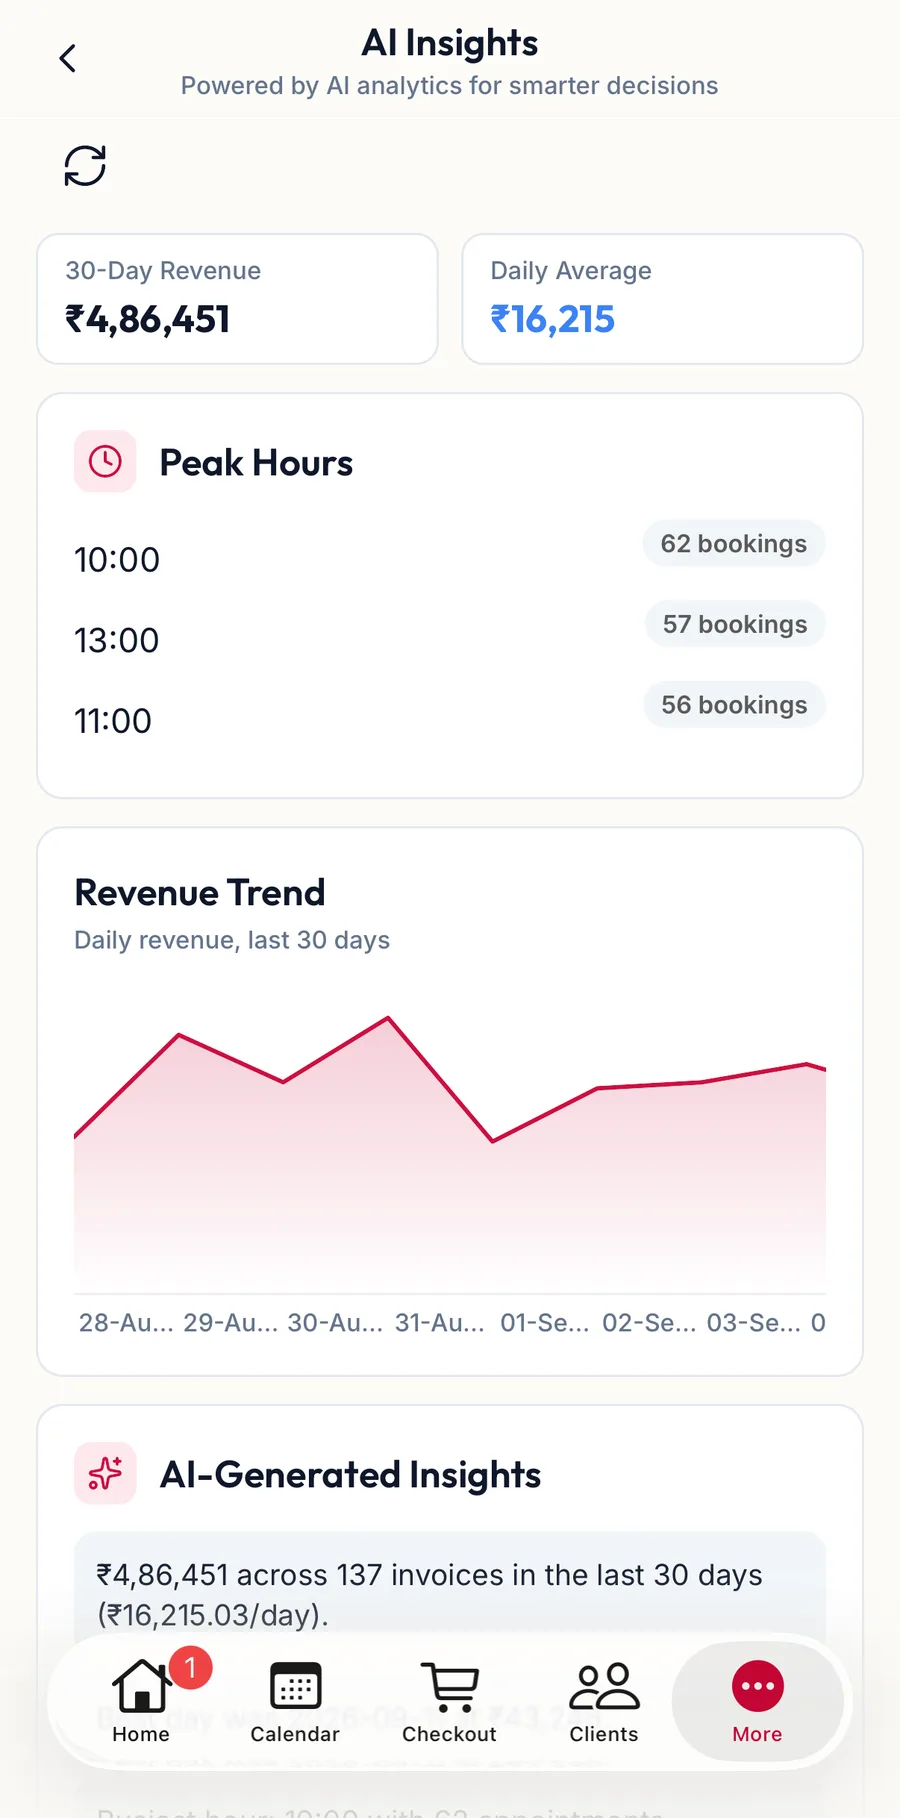
Tap More, then AI Insights. The Revenue Insights tab shows the same tiles, trend, top services and AI-Generated Insights.
Customer Retention
On the web
Counts of Total, Loyal, At Risk, New and Regular customers, a Customer Distribution chart, the At-Risk Customers list (people who have not visited in 90 or more days, each with View customer), and AI Recommendations.
Refresh Insights regenerates both tabs.
In the app
The app currently shows only the Revenue Insights tab on a phone. Open the web portal for the Customer Retention tab, the Customer Distribution chart and the At-Risk Customers list.
Related articles
- AI Assistant · Reports & AI
- Find and filter customers, and use smart segments · Customers